Unit Economics matter, Scalability of the Unit Economics matters more…

I like entrepreneurs who think hard about the unit economics (UE) of their business from very early on in the post ‘product – market fit’ phase. Having said that, I love entrepreneurs who think not only about UE but also, the ‘scalability of their unit economics’. Eliminating the jargon here, what I mean is that does the CEO think hard about how unit economics would evolve as the business grows? Is the management team geared towards testing UE scalability before putting precious resources (cash, human capital) behind rapid growth? I believe this is terribly important (as I demonstrate the same using the example of a public listed company) as hard lessons have been learnt by both public and private companies who scaled their businesses with a blind eye on the scalability of their unit economics – in essence, as they grew the business the unit economics suffered. Altering unit economics at scale is 100x more difficult (keep this in mind as I revisit this below) than doing so early on and hence, losing sight here has resulted in catastrophic outcomes. The idea of this blog is to stress upon the importance of scalability of unit economics, suggest ways to test UE scalability before you actually put precious resources to grow the business and hopefully, discover pitfalls and set them right early
Before we jump to the example, let’s define unit economics so that we are on the same page. UE has two components – CAC – consumer acquisition cost and CLTV – customer lifetime value. Truly valuable businesses that create sustainable equity value for shareholders have very large CLTVs and very low CACs – there is no exception to this rule!
Before we jump to the example, let’s define unit economics so that we are on the same page. UE has two components – CAC – consumer acquisition cost and CLTV – customer lifetime value. Truly valuable businesses that create sustainable equity value for shareholders have very large CLTVs and very low CACs – there is no exception to this rule!
- CAC is a how much do you spend to acquire a new customer
- CLTV is a function of how much you make in margins post all direct costs and how long you retain the customer. Customer retention health is often measured as % of customers lost or more commonly referred to as Churn (%)
The following charts describe the progress of a publicly listed company wherein the stock price has fallen off a cliff (high double digit drop since the company listed). The graph might look a little complicated at first but the following explanation should make it easy (if not, please let me know and I can think of an easier way of depicting the same)
Quick explanation of the graph below –
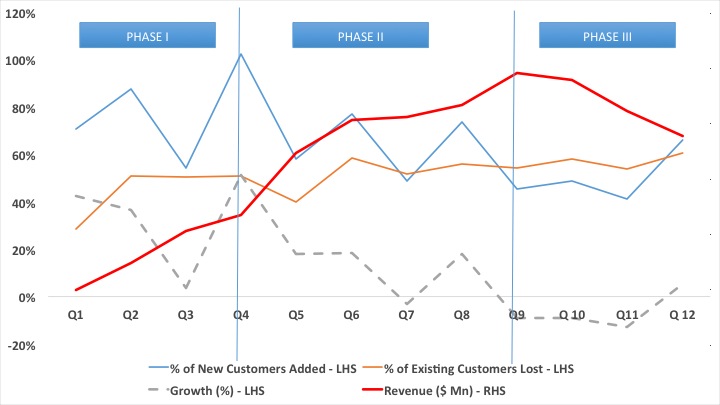
- Red Line – represents $ Mn revenues for the company. They are plotted on the RHS – (I have taken out the exact numbers on purpose)
- Blue Line – represents the new customers acquired in the current quarter as a % total transacting customers in the previous quarter. Plotted on LHS.
- Orange Line – represents the existing customers lost in the current quarter as a % of total transacting customers in the previous quarter. Plotted on LHS.
- Grey Line – depicts revenue growth which is the difference between the Blue and Orange lines. To illustrate this better, the new customers added in Q4 were 102% of the customers transacted in Q3 and the number of customers lost in Q4 were 51% of the customers that transacted in Q3 and hence, the revenue growth in Q4 over Q3 is 51%(assuming little or no change in spend per customer). Plotted on LHS.
Phase I – Q1 – Q4 – ‘The GoldenPhase’
As you observe above, Q1 – Q4 represents the golden period for the company. Revenue (red line) is growing at a fast clip. Growth (grey line) is being driven by the difference between new customers added as % of previous quarter’s transacting customers (dark blue line) and existing customers lost as a % of previous quarter’s transacting users (orange line). Company enjoys market leadership position. Everybody is happy- the company raises more capital at crazy valuations – with this comes the pressure to grow faster!
Phase II – Q5 – Q9 – ‘Unit Economics Catch Up’
Company pushes for growth – increases marketing spend, adds capacity. But growth is not responding as well as they would have liked – customers lost or Churn (%) remains high at 50-55% while the new customer addition is slowing down which means revenue growth is slowing down. The company responds through higher marketing spends which lifts the new customer acquisition but churn is unrelenting in the business. I now go back to the point made earlier that altering unit economics at scale is 100x more difficult – imagine you have 100 transacting customers and 50% churn – you need to add 100 new customers to grow 50% – seems easy!. Now assume you have 100,000 customers and 50% churn, you need to add 50,000 customers to avoid de-growing – Phew! Churn takes over and revenue growth stalls. At this point, the company finds itself in an extremely difficult spot – the management needs to go back to the drawing board to understand and solve for for fleeing customers and also, understand the efficiency of new customer acquisition. Cash reserves are depleted with money spent on marketing. Public investors punish the stock! @UnitEconomicsCatchUp!
Phase III – Q10 – Q12 – ‘Back to Square One’
Company is in cash conservation mode trying to figure out unit economics! (back to square one) – churn remains high and as a consequence, company experience revenue de-growth.
Phase III – Q10 – Q12 – ‘Back to Square One’So what could you do differently?
Nothing rocket science! – the fundamental idea here is to be able to successfully experiment the scalability of your unit economics with a representative subset of your target market. This could be one geographic market or even with a particular target audience (based on past behaviour, demographics etc.) or a combination. Failing to scale unit economics in one geography, understanding the pitfalls and solving for them is far easier, cheaper and valuable in the long run. In the above example, 50% churn should have been arrested (maybe they did make an effort and failed). Having said that, if they did fail to arrest the 50% churn, they should have looked to dramatically reduce customer acquisition cost – this would have brought back the CLTV – CAC difference and allowed them to have healthy unit economics.
In Summary –
- Unit economics change with business scale – successful entrepreneurs have a very strong understanding of how UE will trend with scale
- Raising large amounts of cash can take care of poor unit economics only in the short run. Long run profitability and shareholder value is driven by healthy unit economics – and trust me, good or bad, unit economics catch up!
- Test unit economics scalability with a subset of your target market. Solve for key challenges before you put scarce resources to work.
- If you can’t measure it, you can’t improve it!