Measuring ‘Product-Market Fit’ – Is your startup ‘CURWing’ in the right direction?
“If you can’t measure it, you can’t improve it”

A lot has been written about the concept and importance of ‘product – market fit’ – having said that, I have always found entrepreneurs yearning for some structure or simple framework around identifying, defining, measuring and improving key metrics that would enable them to claim strong ‘product – market fit’. The following is an attempt to bring out four key metrics that form the fundamental building blocks of product – market fit.
I believe there are 3 important stages in the life-cycle of a startup – (1) Product – Market fit (2) Finding a scalable & profitable Growth model (3) Rapid scaling of growth model. At the cost of stating the obvious, these 3 stages are sequential in nature which means that one cannot be finding ‘product – market fit’ post putting money behind scaling customer acquisition channels (read ‘recipe for disaster’). Having said that, ‘pre-mature scaling’, defined as trying to scale the business without finding strong ‘product – market fit’, is one of the top reasons for startup failure in my experience.
Finding strong ‘product – market fit’ is a hard problem to solve – it requires founding teams to be super disciplined (not getting seduced into throwing money at the problem!), focus on data driven decision making during an iterative product development phase with multiple failures along the way, and last but not the least, fight competitive pressures to bring to market a product that customers love! (loving the product / service and love for discounts are two very different things!) In this most crucial startup phase, the founders need to identify key metrics that they are chasing and then doggedly work towards tracking and improving them. I have witnessed founders are often flying blind or even worse tracking vanity metrics during this phase. Add to this the complexity that every company is unique and hence, has a unique way of measuring ‘product – market fit’ (Having said that, at the core of product – market for any company are four key metrics – it’s just that every company finds a unique way to measure these metrics based on the business they are in). Post defining the key metrics, I will take up some examples as to how these metrics might be measured differently across businesses (stay with me, there is light at the end of the tunnel!)
Following are the four key metrics – I often call it the ‘CURW’ (pronounced at CURVE) framework- the acronym is born out of the first letter of each of the four metrics. (While evaluating the ‘product – market fit’ for a company, I often question if the company is ‘CURW’ing in the right direction?)
-
Conversion rate (C) – simply defined as the ratio of number of unique customers who complete a desired task (be it a transaction or an interaction like a message or a post) to the number of people who came to the website (or launched the mobile application). A high conversion metric means is that if the product is presented to the right audience they lap it up! Following are some of the key points to keep in mind as you set off to define and measure the metric –
-
Defining and tracking the right conversion metric is very important – for example, average conversion rate from traffic to paying customers for a hyperlocal restaurant delivery startup across cities is meaningless! – the metric needs to be defined for a particular geography, in this case a city, wherein the company has built strong supply of restaurants. Defining this metric narrowly with utmost intellectual honesty is key to steering the startup in the right direction.
-
Measure conversion for organic and paid traffic separately – often a lot of early adopters come from organic channels and can hide the poor conversion funnel for paid customers – this means any increase in paid customer acquisition will result in dramatic increase in customer acquisition cost (or cash burn!) which more importantly indicates poor ‘product – market fit’
-
I often find entrepreneurs not being able to distinguish between rapid early adoption and high conversion rates – you might have strong early adoption but conversion rates might still be low! – indicates poor ‘product – market fit’
-
Conversion rates vary dramatically across industries – for example, for a travel startup 4-6% conversion is gold standard while the same is poor for a food delivery startup. And hence, it is important for entrepreneurs to know what is ‘gold’ standard within their industry. The idea is not be gold standard day one but to be able to understand the key drivers of conversion and move the conversion metric graph to the top right corner. Following is a great resource for founders can use to start bench marking their progress –
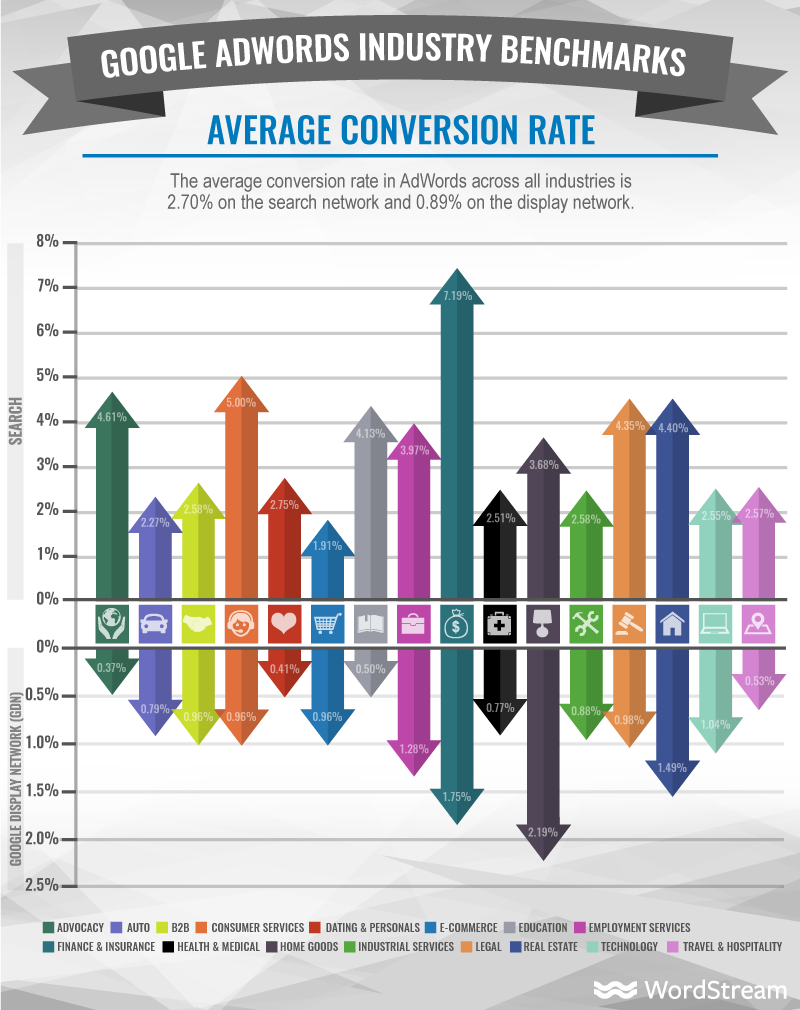
-
Improving conversion rates should be a never ending pursuit for the startup ( a longish blog is in the making!)
-
I have talked more about the importance of this metric here –3 Cs of Profitable Growth – ‘Key Metrics to ‘kill for’ or else get ‘killed’’
-
-
Usage (U) – in order to narrow down on the right metric for measuring product usage, its important to think about the core action you wish your users to perform (need not be revenue generating day one!) for example – number of prescriptions created by doctor per day on an EMR product is a great metric to track usage similarly, amount of time spent on the travel blog for a holiday travel planning platform is a good usage metric to track. Higher the usage means the consumer becomes used to the product which means the product could become ‘habit’ forming! – higher the usage lower is the probability of customer leaving the product / service which in turn indicates strong ‘product – market fit’
-
Retention (R) – simply measured as how many customers come back to use your product / service as and when the need arises. Measured in the form of customer cohorts often tracked by when they made their first transaction or desired action on the platform – “If 100 customers made a transaction in January, how many made transactions in the month of December?” I encourage transaction led startups to measure at least 3 cohorts across – customer, order and GMV or revenue cohorts. Measuring metrics like number of orders per customer per year or spend per customer per year for every cohort is a great retention metric to track. If this number if improving it’s a great sign that customers are spending more on the platform! which in turn indicates strong ‘product – market fit’. Finally, higher retention means better profitability and also, reduced pressure on marketing for growth (Read more here ‘Retention’ – The Forgotten (Super) Growth Driver !!)
-
Word of mouth led customer acquisition (W) – while retention drives profitability in the long run, word of mouth led customer acquisition drives ‘long term profitable growth’ which I believe is much more powerful than just retention. If your product is great it will be discussion worthy and people will share notes both in person and social media! Products with strong ‘product – market fit’ witness acceleration in word of mouth led customer acquisition over a period of time.
Following is an attempt to lay out how each of the core metrics are measured differently by different startups –
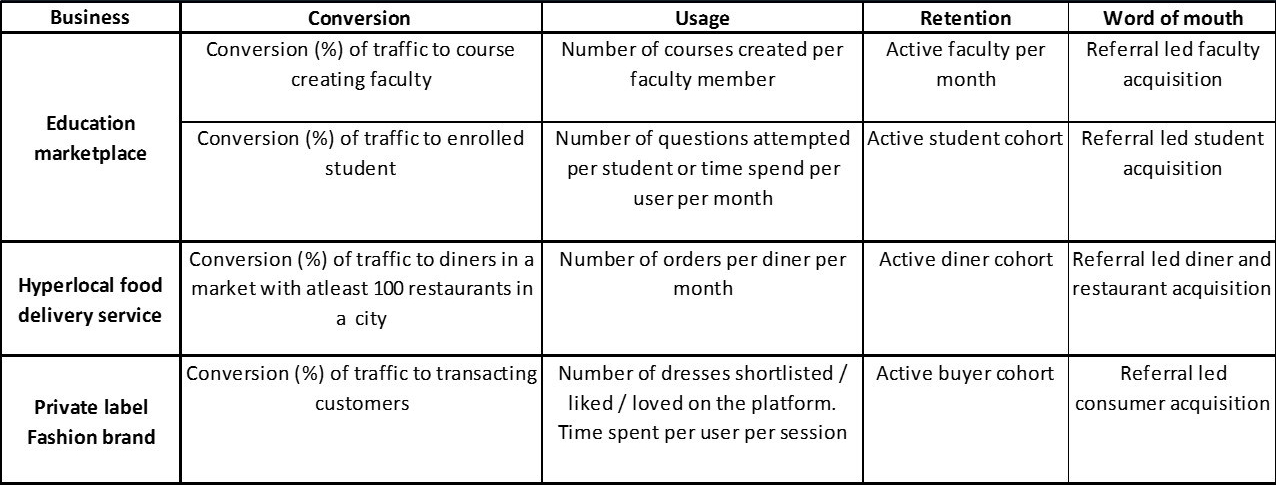
To summarize,
- Conversion, Usage, Retention and Word of mouth are the four key metrics that define product – market fit. Work diligently with your board / mentors to identify, track and improve metrics important for your business (reach out if you think, I can help!)
-
Strength of product market fit is governed by how many of the 4
metrics are working.
- ‘Working’ means that performance of each metric is improving rather quickly month on month
- Founders know exactly why this is happening and how they will continue to pull the metric up! >
- You need at least 2 of the 4 working well for you before you can claim product – market fit (don’t forget to call me if this working for you!)
- Magic happens when all 4 work together!
- “If you can’t measure it, you can’t improve it”